
Cartography Portfolio
These maps by Biogeo are selected to show a range of cartographic and modelling outputs.
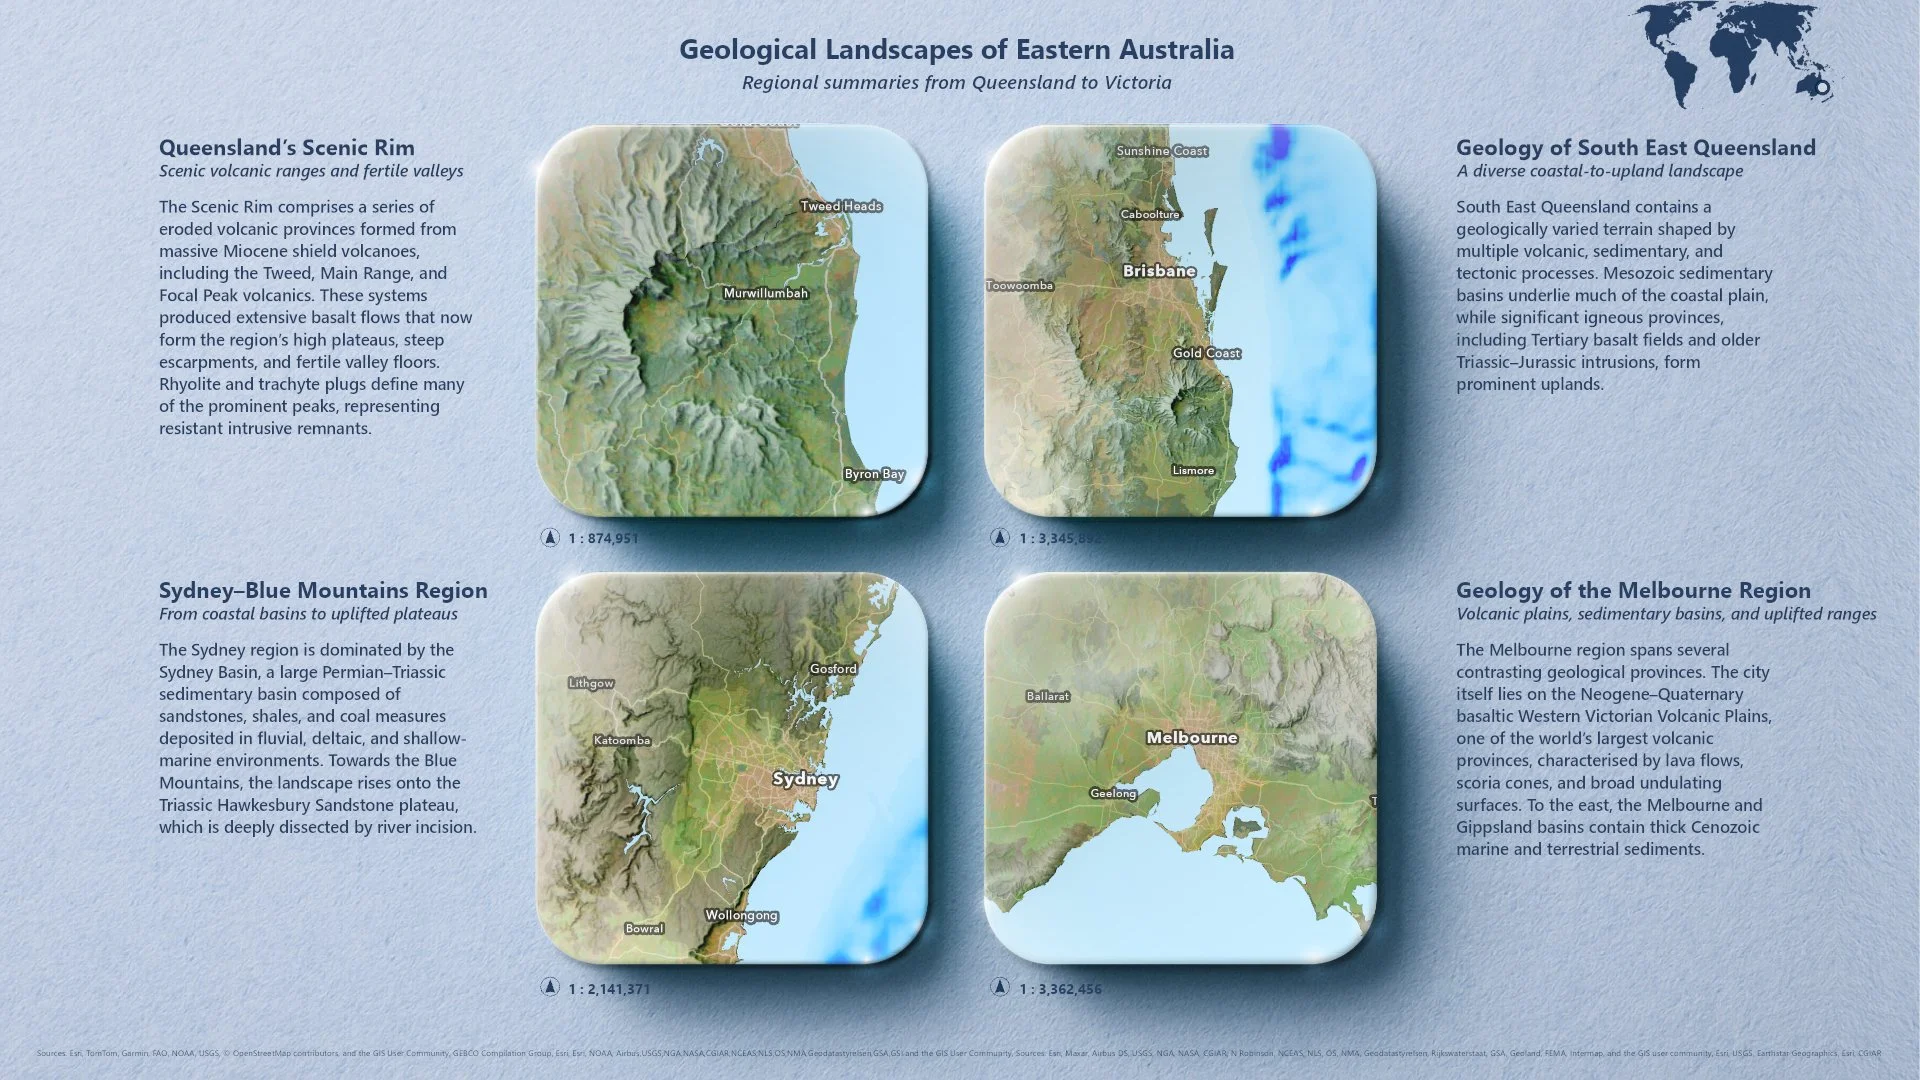
Regional Geology Maps Presented as Blocks
These John Nelson inspired maps were produced in ArcGIS Pro and arranged in a single layout to illustrate the geological diversity of the Scenic Rim, South East Queensland, Sydney–Blue Mountains, and Melbourne regions. Each map was exported as an individual block and styled with subtle shadowing to create a sense of depth on the page.
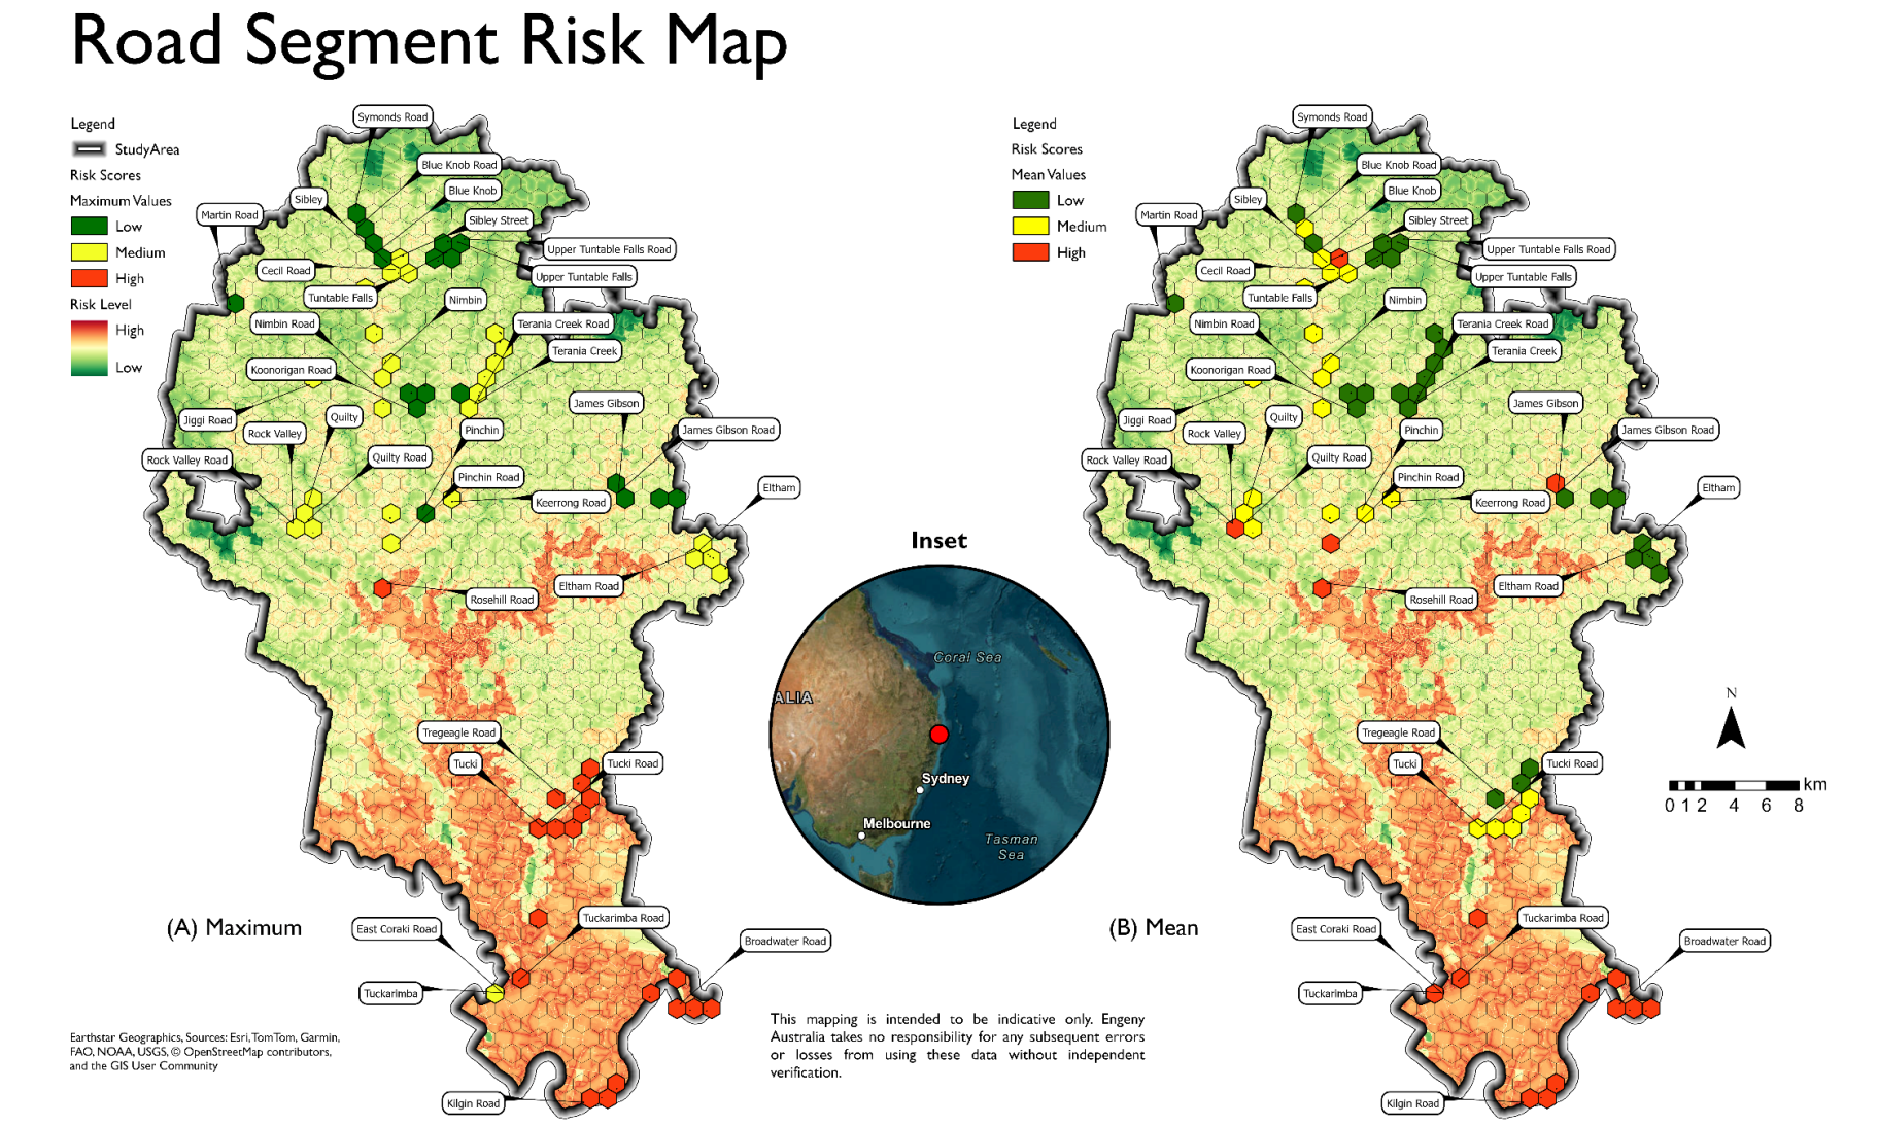
Road Upgrade Risk Assessment Map
The map displays the results of a spatial risk assessment used to prioritise road-upgrade works. It shows a graded risk surface derived from elevation, flood extent, drainage proximity, land use, and land-tenure inputs, highlighting where upgrades are likely to be most constrained. The road network is segmented and classified into High, Medium, or Low risk based on zonal statistics, providing a clear visual indication of where flooding, surrounding development, or ownership factors may influence upgrade feasibility.

MaxEnt Model Outputs - Predicting Habitat Suitability
These maps portray the outputs from maximum entropy (MaxEnt) models. The upper map represents habitat suitability scores for the greater glider and the lower map for the feather-tailed glider.
The models themselves were generated using the R statistical program with the resultant rasters imported into a GIS for styling and symbology.
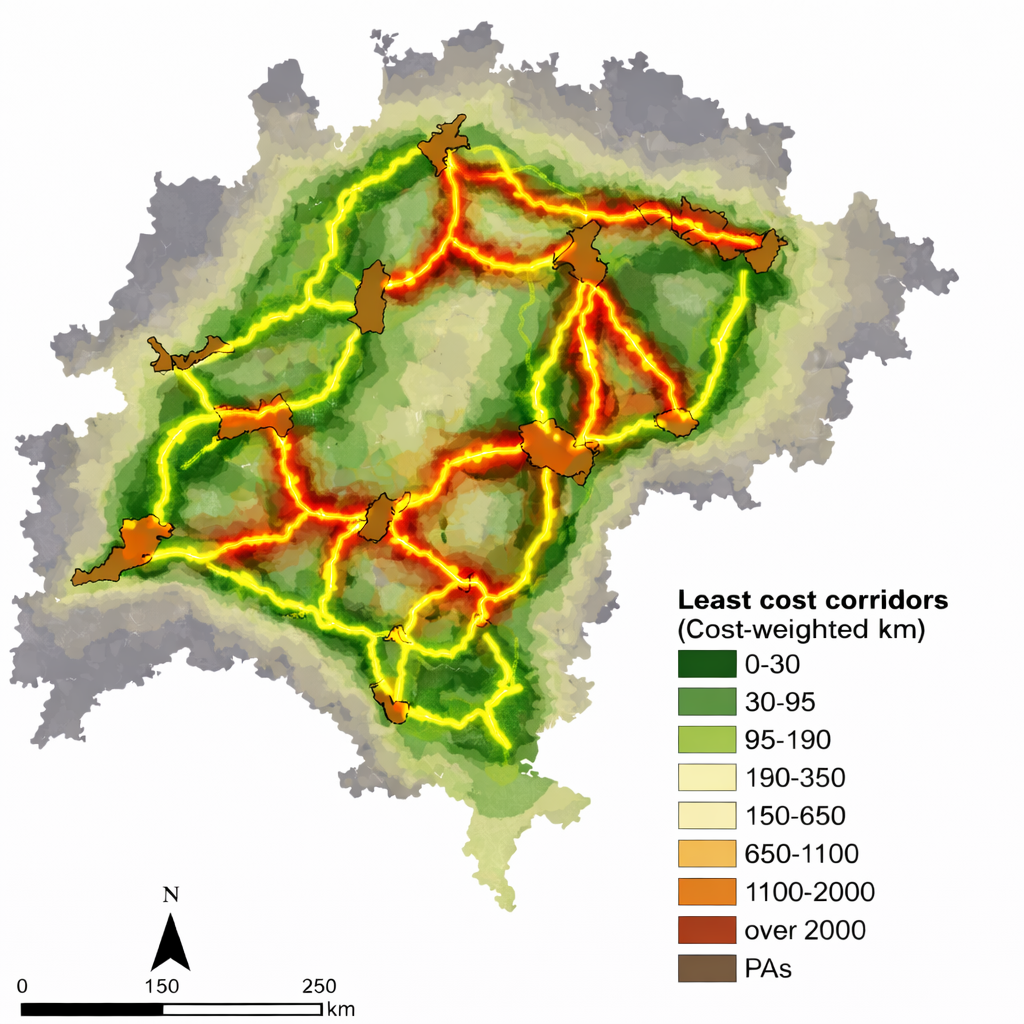
Wildlife Corridor Modelling
This map presents the outputs of a wildlife corridor model identifying least cost movement pathways across a heterogeneous landscape. The analysis is based on a cost surface representing relative resistance to species movement, derived from land cover, terrain, and other ecological constraints. Areas of lower cumulative cost are shown in green, transitioning through yellow to red as movement resistance and accumulated cost increase.

Vintage Style Atlas Map
This vintage-themed atlas map was developed for illustration purposes. It was produced by overlaying multiple layers along with experimenting with the symbology.

Target Species Observations -Scenic Rim
This map was generated to highlight a way of illustrating the abundance and distribution of species using bin grid cells. The charts below the maps provide the temporal distribution of data.

Scenic Rim Wildlife Corridor
This map was created to support the Wildlife Preservation Society (Scenic Rim Branch) in depicting their ambitious wildlife corridor project.

Usable Solar Radiation for Central Brisbane
A representation of the average annual usable energy for rooftops in Brisbane’s CBD (in megawatt-hours per square metre) with orange and red colours indicate higher-yielding locations.
Three-dimensional data was used to calculate the elevation, slope, and aspect of each roof space in order to estimate annual energy yields.

Three Dimensional View of Central Brisbane
A three-dimensional map of Brisbane’s CBD with globe-style inset.

Suitability Modelling - Sub Models
This map represents a range of sub-models that individually identify desirable areas for brush-tailed rock wallabies based on their habitat requirements (e.g., remnant vegetation, habitat type, terrain roughness index - a surrogate for rockiness and availability of predator refugia, aspect – brush-tails typically occupy sites with a northerly aspect, distances from a watercourse, and previously recorded sightings).

Suitability Modelling - Brush Tailed Rock Wallaby
This map represents the final model from a weighted overlay analysis to determine levels of habitat suitability for brush-tailed rock-wallabies.

Distribution of gliders across Queensland
This figure was generated for a report summarising the distribution of gliders in Queensland (multiple species) using hex bin cells.

Dawson River - Study Area
This map was created to support the Wildlife Preservation Society in depicting a study area for a research project.

Suitability Modelling - Sub Models
This map represents sub-models that individually identify desirable areas for a specific species for reintroduction into the wild.

Horizontal distribution of major macrozooplankton species in the south-west Atlantic sector of the Southern Ocean.
Data are means of results from stations lying within each 2° by 5 ° grid cell.

Web mapping application to support a wildlife corridor conservation project
The program we developed is a full-screen mobile-friendly application with a responsive navbar and modal placeholders using Bootstrap 3, Leaflet, and typeahead.js, and builds on the excellent Bootleaf code. Features include client-side multi-layer search with autocomplete and a responsive sidebar synced to the map bounds that can be sorted or filtered.